Integrating Xero data with Power BI shouldn’t be complicated. Whether you’re an accountant monitoring cash flow or a COO looking for real-time operational metrics, getting the data you need shouldn’t take hours of manual effort. At Connectorly.io, we help bridge the gap—so you can bring your Xero data into Power BI Desktop quickly, securely, and with minimal configuration.
Can I connect Xero to Power BI Desktop without writing code?
Yes. With Connectorly’s integration, there’s no need to develop custom APIs or maintain complex scripts. Our prebuilt connector and report templates eliminate the technical friction and let you focus on insight, not infrastructure.
To get started, you’ll need an active Connectorly account, a Xero organisation you have access to, and Microsoft Power BI Desktop installed on your computer. Once those are in place, logging into the Connectorly app will guide you through linking your Xero organisation. After authentication, you’ll be able to generate a secure API URL that connects Power BI directly to your Xero data.
How do I set up the Xero data connection in Power BI Desktop?
Once you have connected to Xero, the quickest way to get started is to:
Open the template in Microsoft Power BI Desktop
Enter your connection details
Follow our video or read on for details.
Download a Template
You can download any of our templates for free from Connectorly for Xero and Microsoft Power BI Templates.
The library is frequently updated, so you may want to check back from time to time to see what is there.
Open the template in Microsoft Power BI Desktop and Enter the Connection Details
Once you’ve downloaded a Power BI template, double-click to open it in Microsoft Power BI Desktop.
You will need to enter your unique connection settings, which are found in the Connectorly App
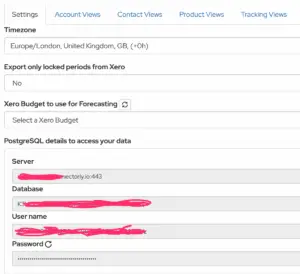
Copy the Server and the Database from the Connectorly App
Now copy the User name and Password from the Connectorly App
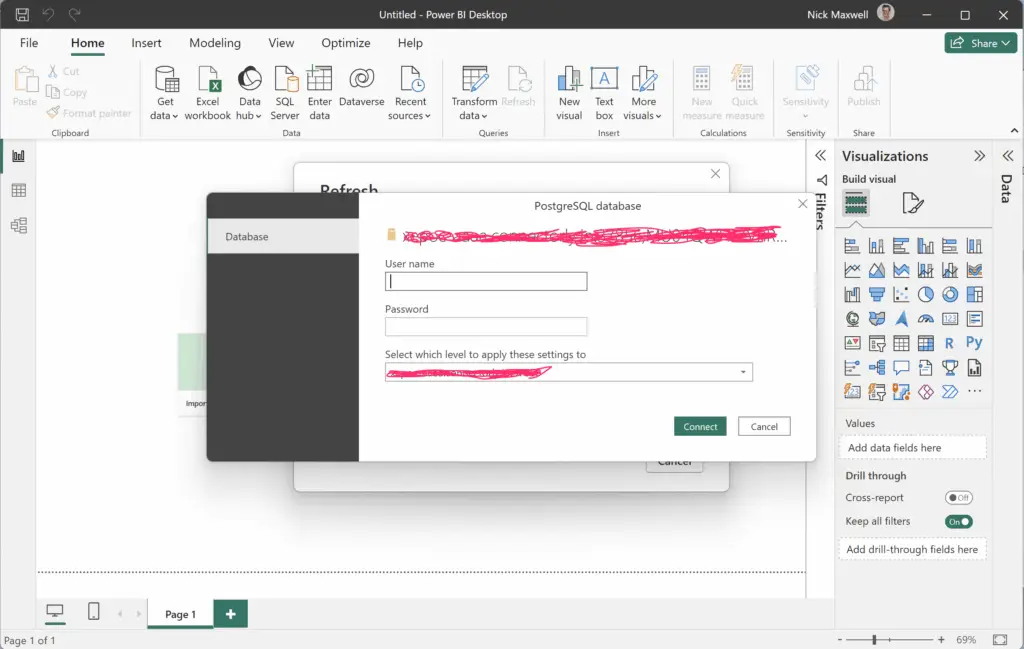
That is all, now the template will open and show the report based on your data
What if I want prebuilt reports and dashboards instead of starting from scratch?
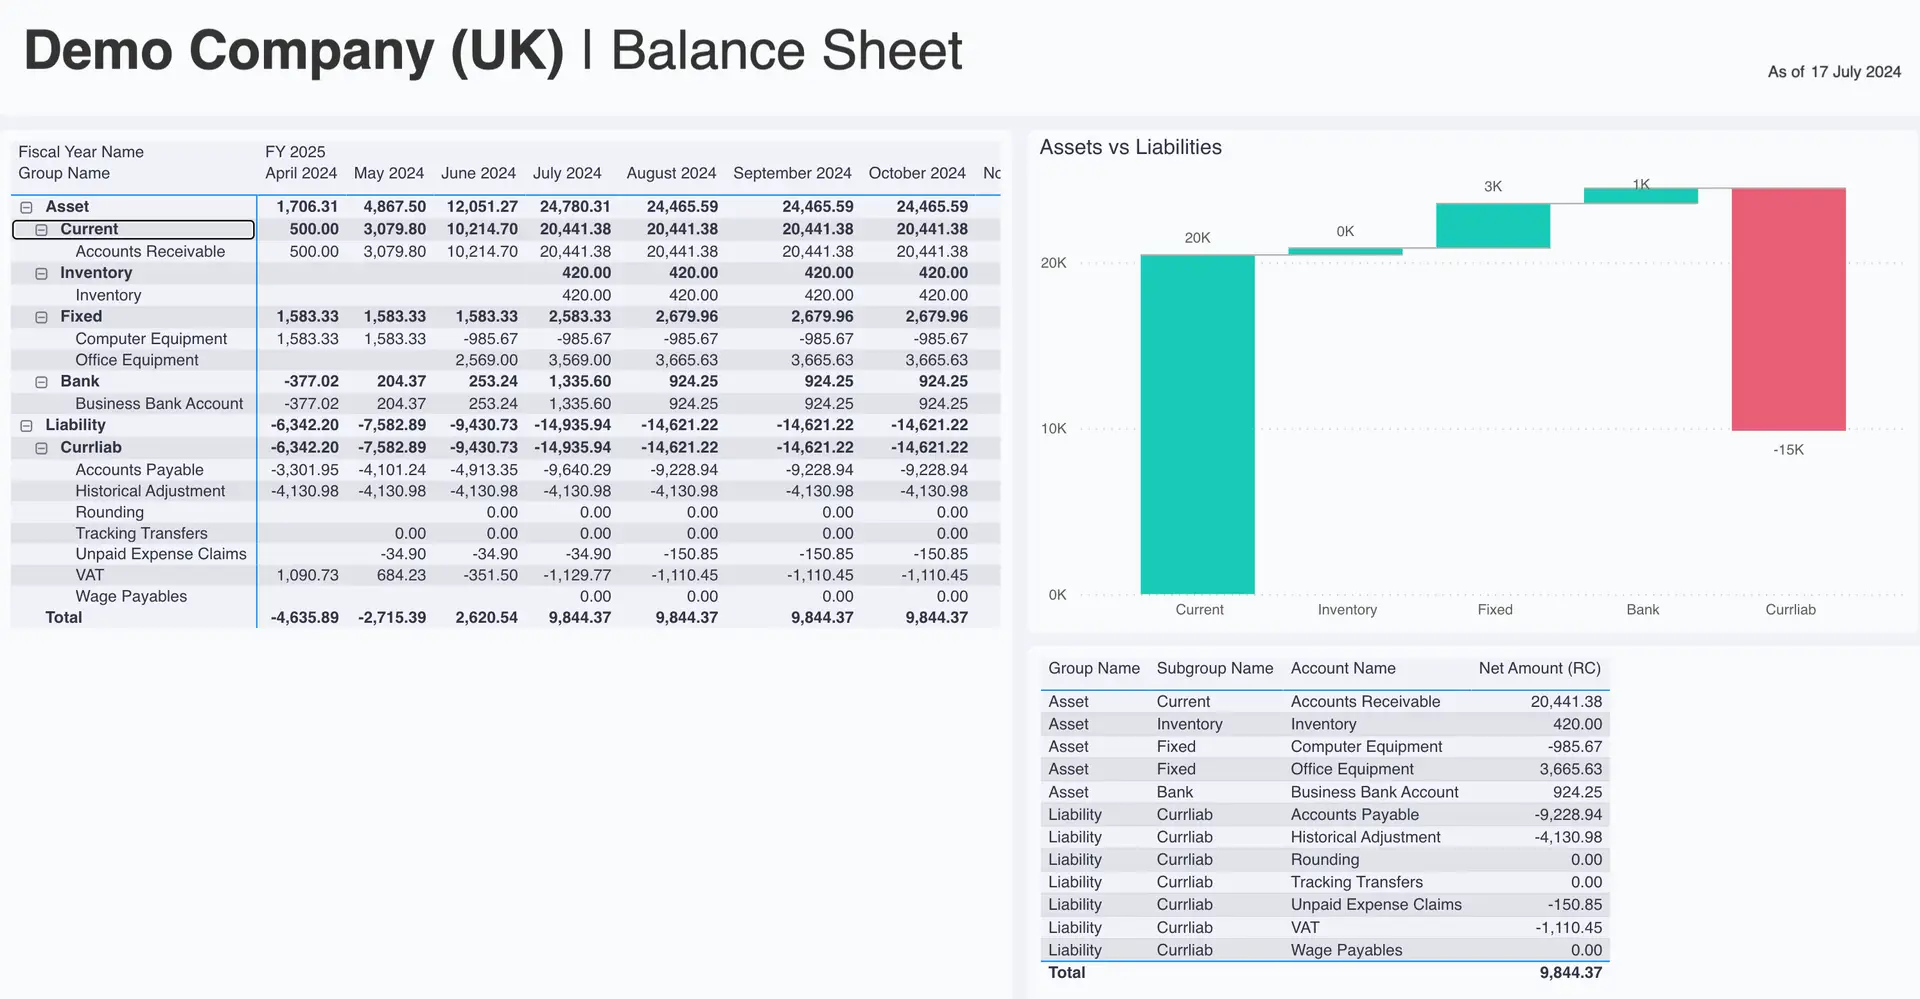
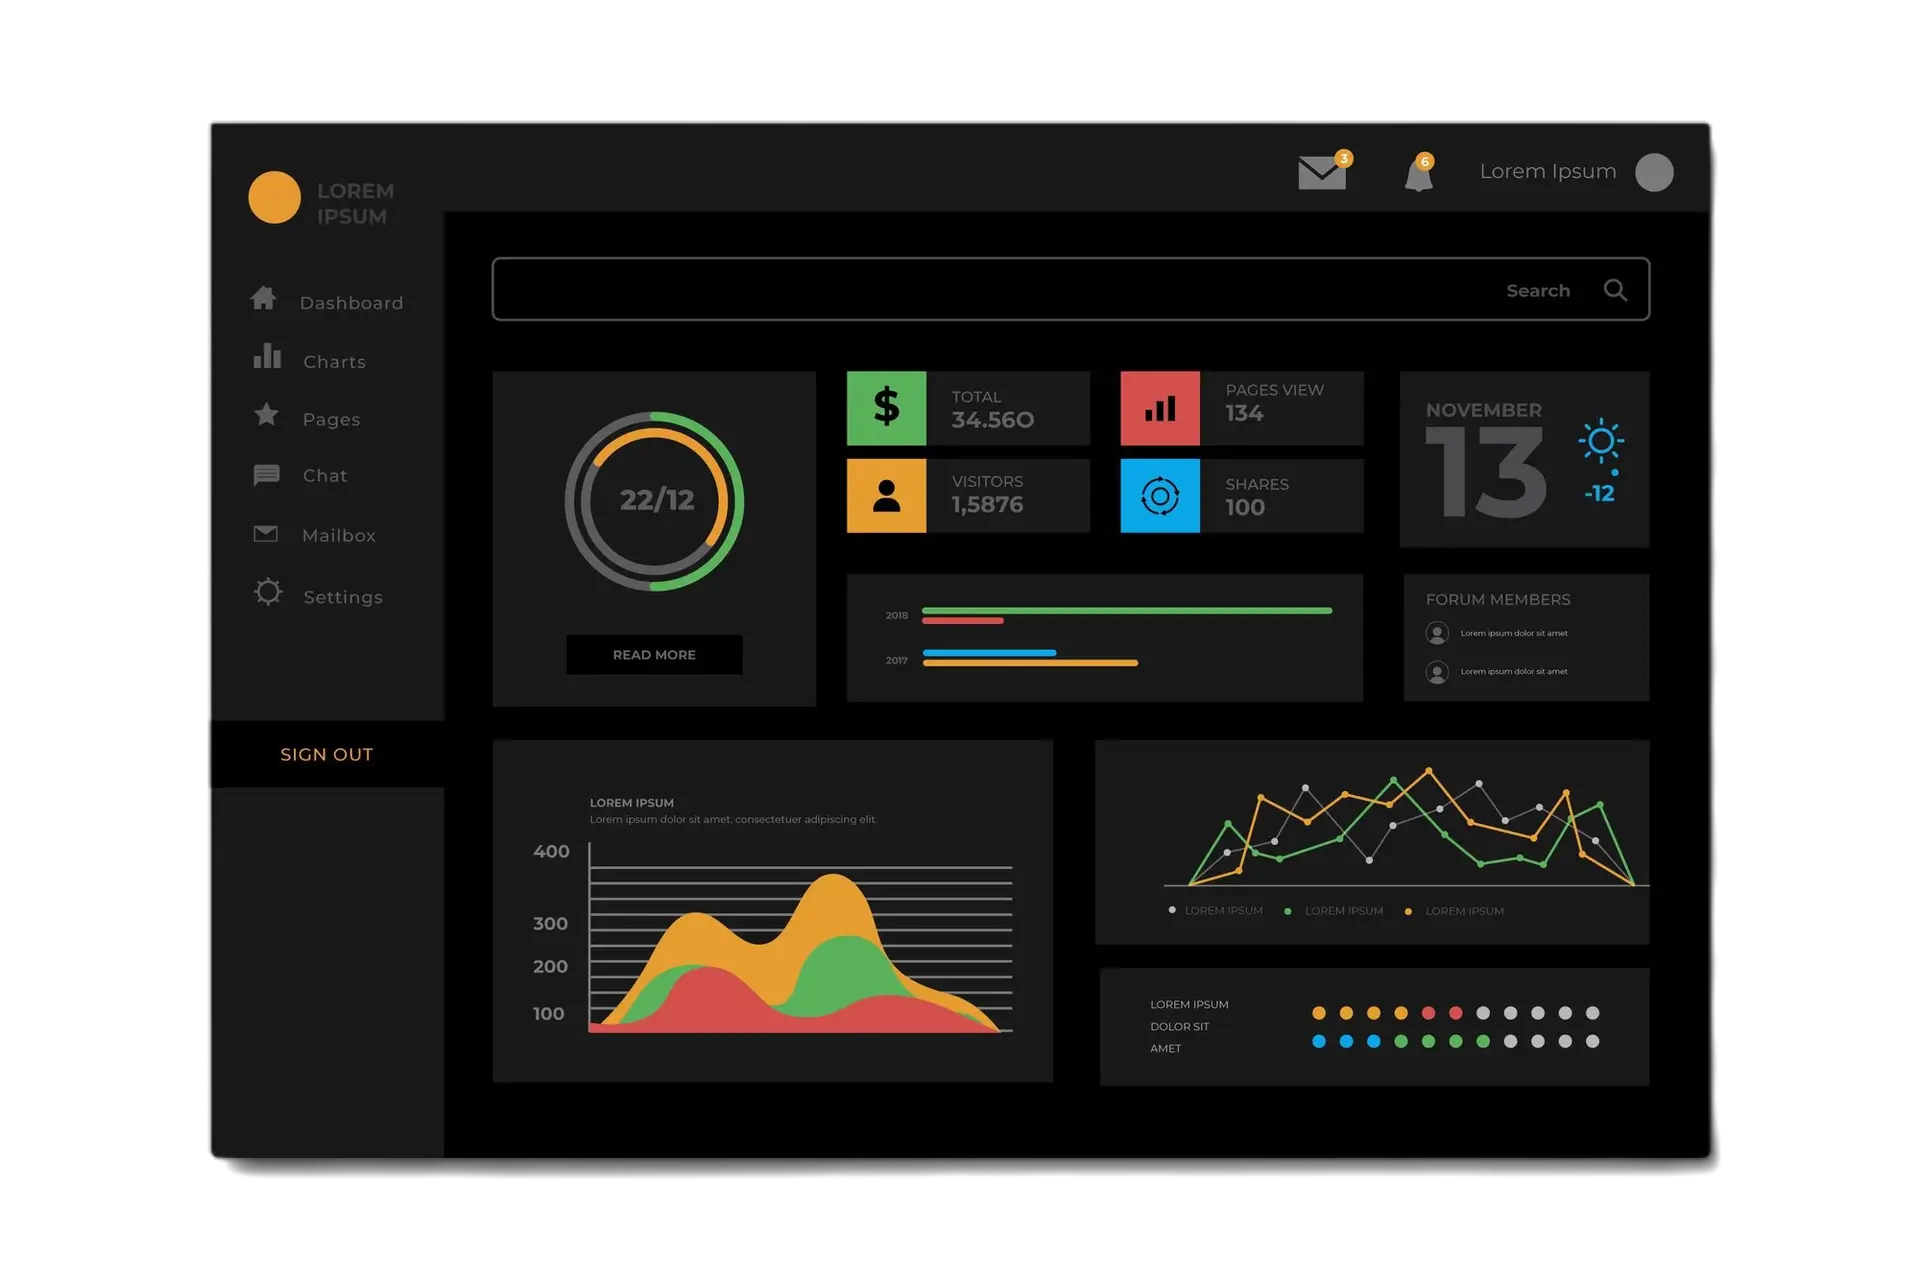
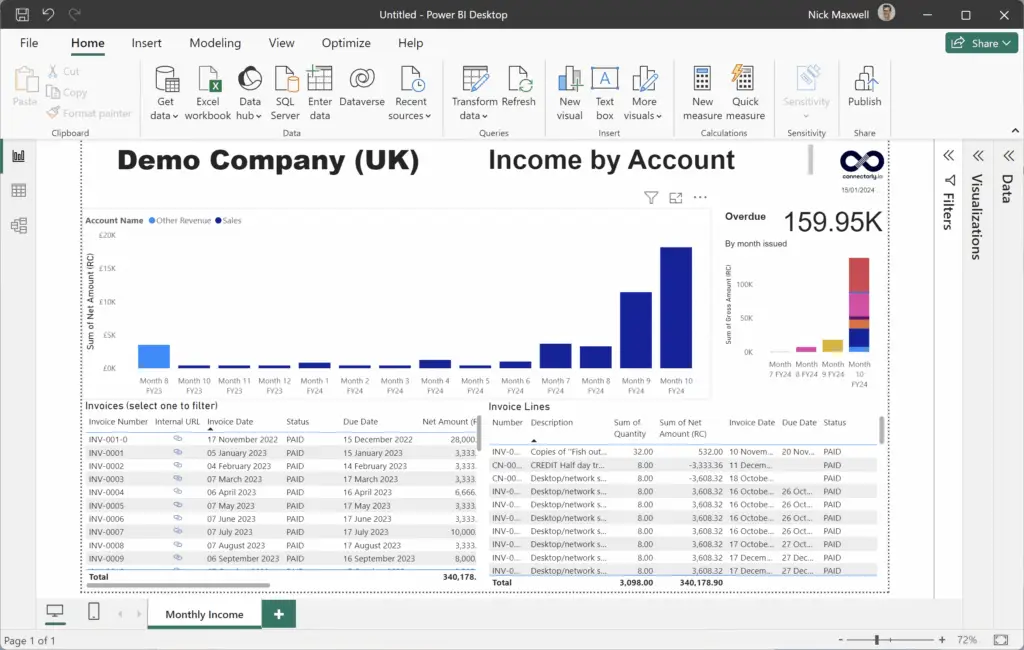
That’s exactly what our Power BI templates are designed for. Rather than building every visual manually, you can start with a clean, well-organised report structure that reflects your Xero data out of the box. Our templates include key visuals such as monthly revenue trends, overdue invoices, and a full Profit and Loss view.
Each template comes built on the Connectorly Xero Data Model, so there’s no need to manually align columns or set up measures. Once your data is connected, the visuals populate automatically. If you’d like to go further, Power BI’s flexibility allows you to customise the layout, apply filters, or build additional pages for board reporting or department-level insights.
Can I start creating reports from scatch?
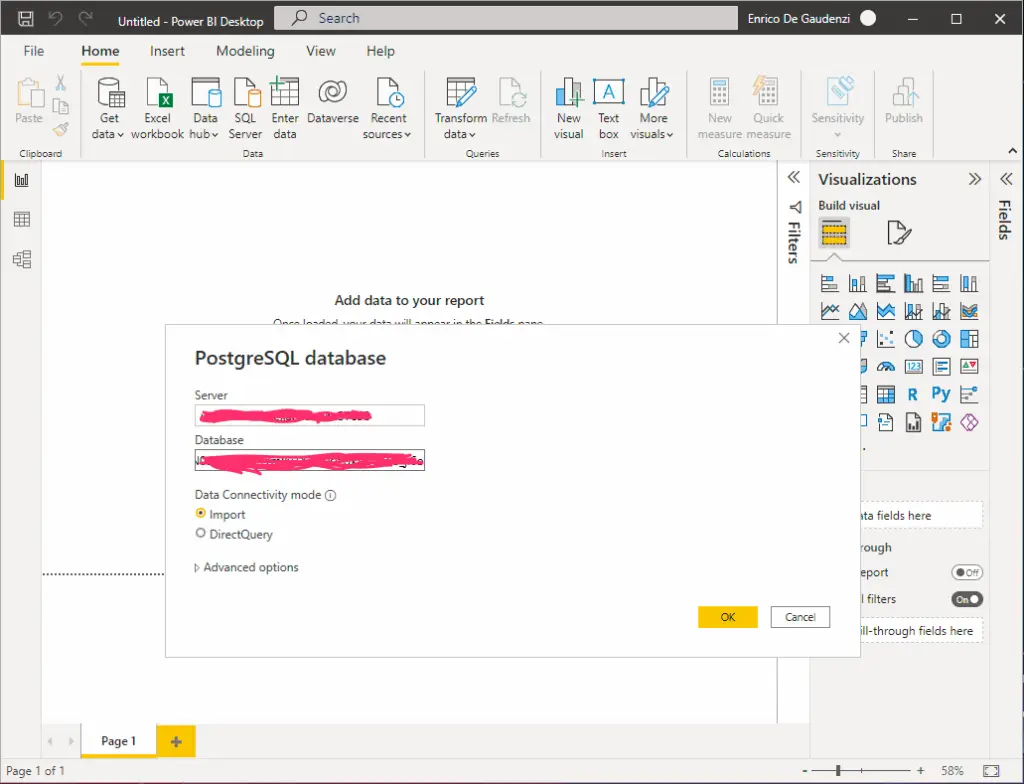
Absolutely, that’s no problem. If you prefer not to use our free templates, you can start with a blank report in Power BI Desktop. To access your data you need to connect Xero to Power BI. Click Get Data and search for PostgreSQL database. Then, enter your PostgreSQL server details and credentials as outlined earlier.
Once connected, choose the tables you want to work with from the Connectorly Xero Data Model.
Keep in mind that if you’re building your report from scratch, you’ll need to manually define the relationships between tables. (Our free templates already have these relationships set up for you.) For guidance, refer to our documentation on the Connectorly Xero Data Model.
How do I keep my Xero data updated in Power BI?
Connectorly is designed to work smoothly with both Power BI Desktop and Power BI Service. In Desktop, you can refresh your dataset manually at any time. For automated updates, you’ll want to publish the report to Power BI Service and set up a scheduled refresh. As long as your Connectorly credentials and API URL remain valid, Power BI will pull the latest data according to your schedule.
If you’re new to setting up scheduled refresh or want to troubleshoot common issues, our article on managing credentials and automatic refresh in Power BI Online will walk you through the process step by step.
What’s the best way to use this integration for strategic insights?
Once you’re connected and reporting, the real value lies in how you use the data. For example, combining your Xero Profit and Loss data with departmental budgets can highlight areas of overspend in real time. Or you might use invoice ageing visuals to prioritise credit control follow-ups.
For more advanced use cases, check out our guides on building Profit and Loss dashboards or forecasting revenue from Xero data. These resources are designed to help you move beyond static reports and toward proactive decision-making.